Table of Contents
- Table of Contents
- The Setup: Simplest C++ Program
- Structure of the Executable: ELF Format
- What does
g++do? - Analyzing Generated Procedures:
Objdump - Conclusion
- Appendix
The Setup: Simplest C++ Program
Here I have the simplest C++ program in existence:
// main.cpp
int main(){}
and here is the corresponding Makefile for this program (with some utilities we’ll use later):
# Makefile
# We are running g++-9, v9.3.0
CC=g++
# Turn off optimizations because we want to be able to follow the assembly.
FLAGS=-O0 -fverbose-asm -no-pie

main: main.cpp
	$(CC) $(FLAGS) -o $@ $^

dump: main
	objdump -drwC -Mintel main &> main.dump

linker: main.cpp
	$(CC) $(FLAGS) -o /dev/null -x c $^ -Wl,--verbose
Upon execution, the program simply starts up and returns with exit code 0. However, there are a few questions you might be wondering:
- What is the structure of the executable?
- What did
g++do to generate this binary file? - What are the generated procedures being run in assembly?
As we’ll see, the process is extremely complicated. To make this easier to navigate, I have made collapsible blocks identifiable by the cursor next to questions.
Structure of the Executable: ELF Format
Our goal for this section is to understand the format of the main binary.
ELF, which stands for Executable and Linkable Format, is the format used for binaries and libraries that we compile with C and C++. It’s in an unreadable binary format that can be analyzed with several GNU tools. To understand what the assembly outputs are, we must first be familiar with the general layout of an ELF file.
How can I tell that an executable is ELF?
You can identify an ELF file by using the file command:
❯ file main
main: ELF 64-bit LSB pie executable, x86-64, version 1 (SYSV), dynamically linked, interpreter /lib64/ld-linux-x86-64.so.2, BuildID[sha1]=921d352e49a0e4262aece7e72418290189520782, for GNU/Linux 3.2.0, not stripped
How can I get information about an ELF file?
If it does say ELF, you can use readelf to analyze the headers like so:
❯ readelf -e main
ELF Header: ...
Section Headers: ...
Key to Flags: ...
Program Headers: ...
Section to Segment mapping:
  Segment Sections: ...
...
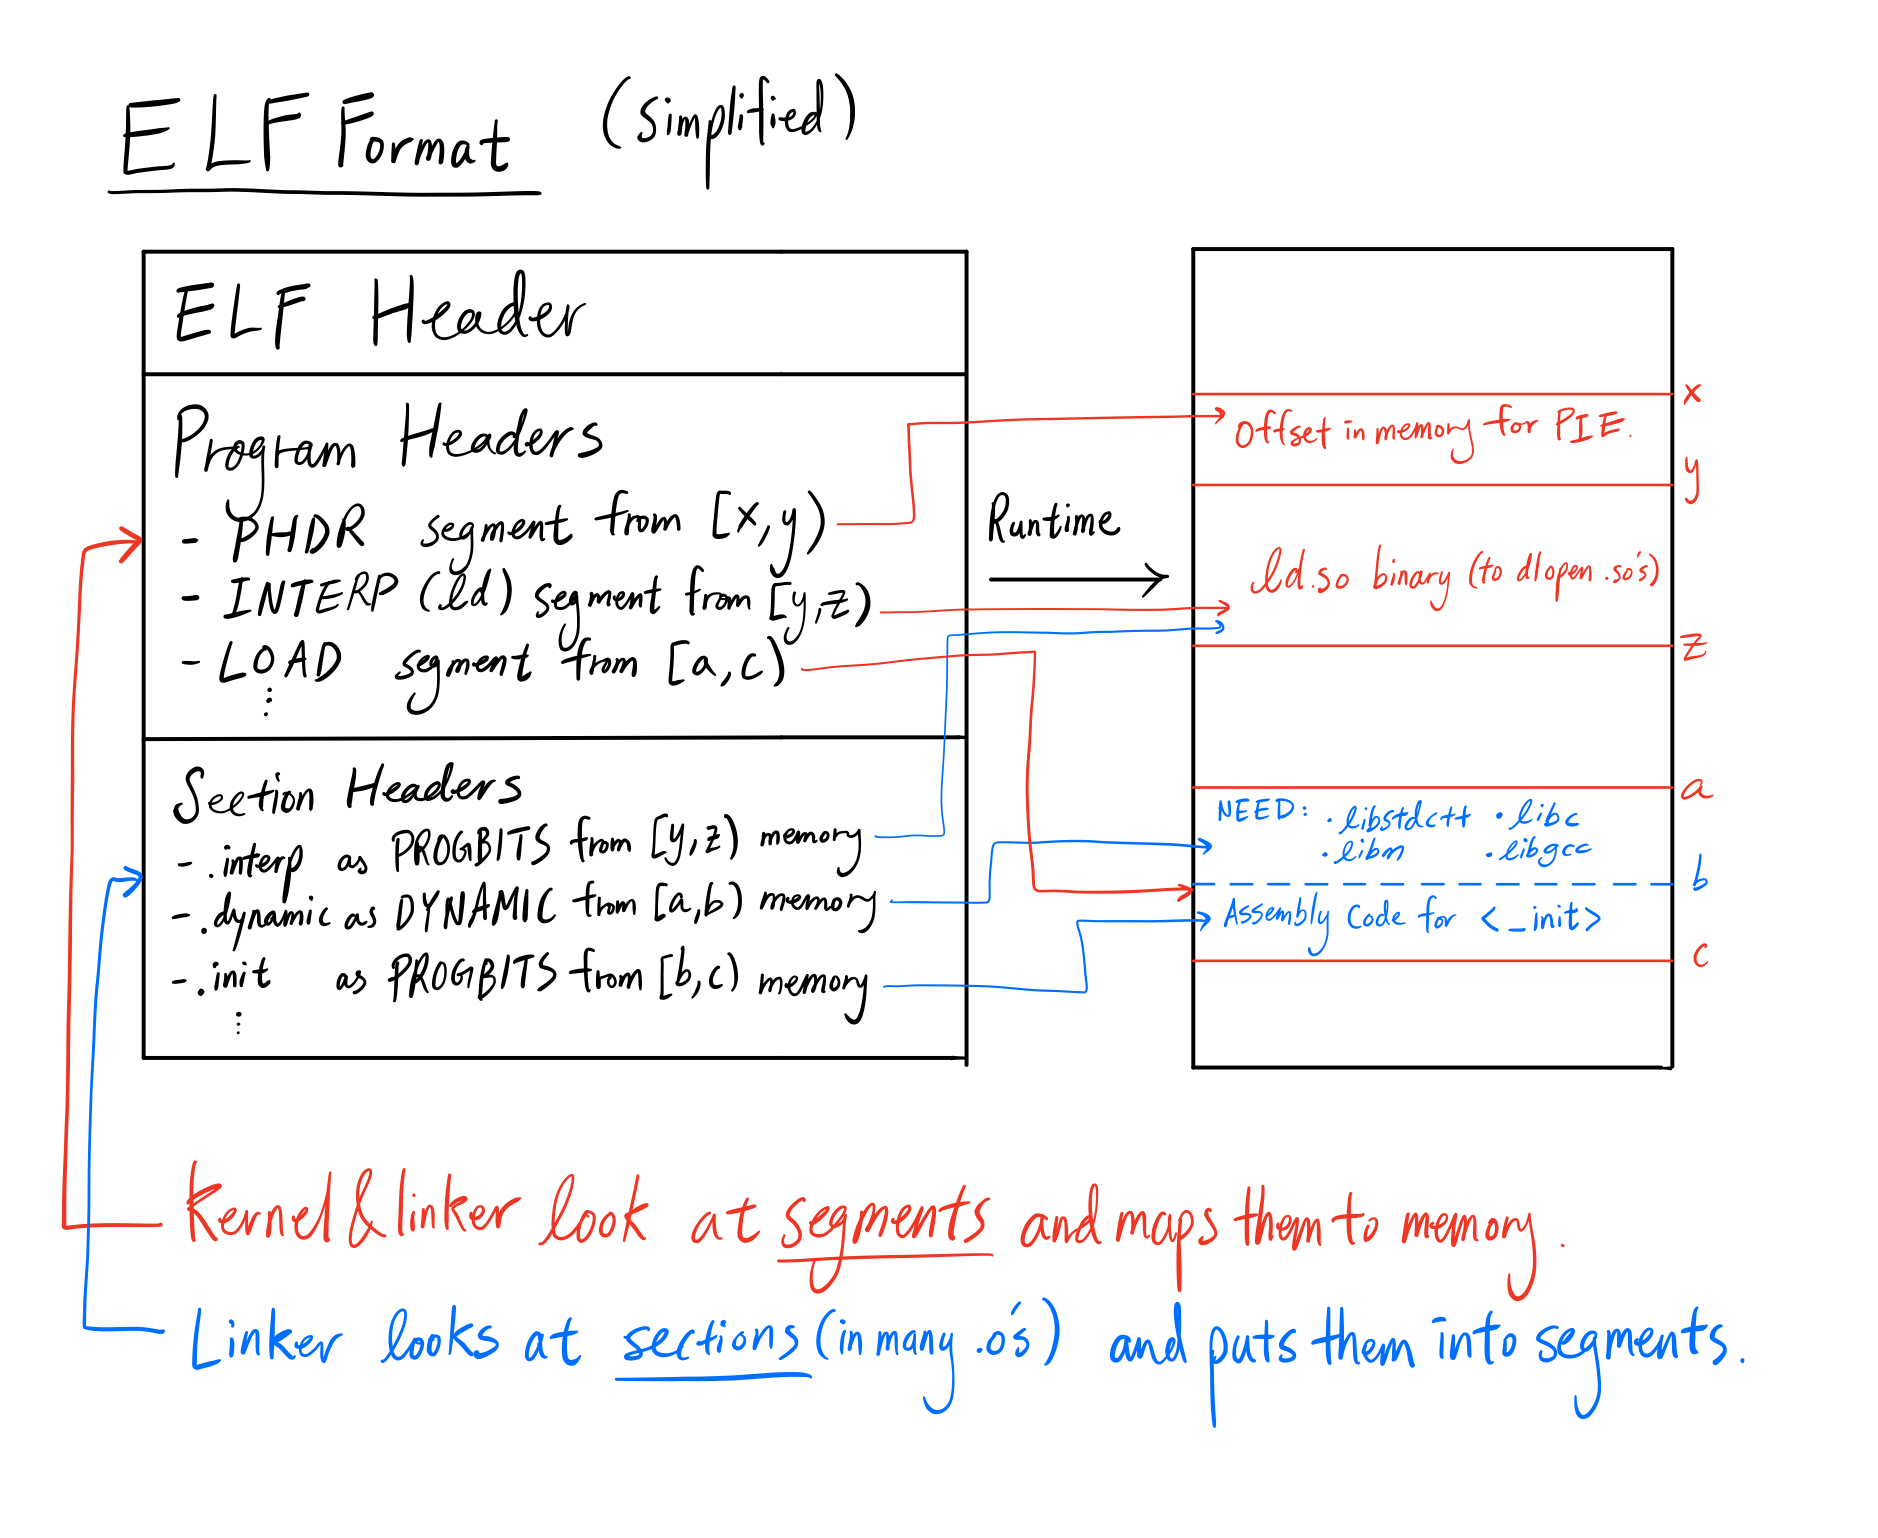
In ELF there is a concept of sections and segments. Sections reside within segments, which are contiguous pieces of memory in the runtime of the executable(the pieces may be 0 bytes). Some sections may appear in more than one segment and it’s because two segments overlap(with the exception of two LOAD segments) with those sections in the intersection. We’ll be going more in-depth on what each of these do throughout the blog.
If we take a look at the ELF Header and Program Headers, we can get a lot of information about the runtime behavior of the executable, so let’s analyze it.
ELF Headers
What does our ELF header look like?
We see the following relevant details in the ELF Header section:
ELF Header:
  Magic:   7f 45 4c 46 02 01 01 00 00 00 00 00 00 00 00 00
  Class:                             ELF64
  Data:                              2's complement, little endian
...
  Type:                              DYN (Shared object file)
  Number of program headers:         11
  Number of section headers:         27
...
What does each section do?
Let’s go through some of these sections:
- The
Magicfield contains the lettersELF, denoted by hexadecimals45 4c 46. To identify whether this file is an ELF format, you need to check the header magic here. - The
Classfield tells us whether this file should be run on a 32-bit or 64-bit architecture. Modern CPU’s are 64-bit, which means the word size is 8 bytes rather than 4 bytes, the addressable memory space is $2^{64}$ bytes(which is practically infinite for any kind of storage) as opposed to $2^{32}$ bytes(which is 4GB, which is roughly the size of a medium dataset for machine learning), and registers can hold 64 bit data. - The
Datafield tells us that the data is stored inlittle endian:
# Little endian has the most significant byte last:
Consider an 4-byte integer represented by: 0x11 0x22 0x33 0x44
The little endian representation (in increasing memory order): 0x44 0x33 0x22 0x11.
and 2's complement is the representation of signed numbers. For any arbitrary positive number $N$ represented in binary, the corresponding $-N$ is represented as bit-flipped $N$ plus 1.
- The
Typefield tells us what kind of file it is. You might be surprised in this case to see that it’s aDYNfor shared object file when we’re actually creating an executable. I was also baffled and asked on StackOverflow here. TL;DR: We’ll be adding the flag-no-pieto turn it into anEXECtype file. The rest of the blog will be based off of that assumption. - The number of program headers is the number of segments that will be mapped into memory upon execution.
- The number of section headers is the number of sections, each of which will be placed into one of the 11 segments.
In general, the ELF headers tells us exactly what kind of platform this binary was compiled for, and a general summary of the structure of the ELF file.
Program Headers
What does the Program Header section look like?
We see the following relevant details in the Program Header section:
Program Headers:
  Type           Offset             VirtAddr           PhysAddr
                 FileSiz            MemSiz              Flags  Align
  PHDR           0x0000000000000040 0x0000000000400040 0x0000000000400040
                 0x0000000000000268 0x0000000000000268  R      0x8
  INTERP         0x00000000000002a8 0x00000000004002a8 0x00000000004002a8
                 0x000000000000001c 0x000000000000001c  R      0x1
      [Requesting program interpreter: /lib64/ld-linux-x86-64.so.2]
  LOAD           ...                                    R
  LOAD           ...                                    R E
  LOAD           ...                                    R
  LOAD           ...                                    R W
  DYNAMIC        ...
  NOTE           ...
  GNU_EH_FRAME   ...
  GNU_STACK      ...
  GNU_RELRO      ...
Each program header is mapped to a segment containing zero or more sections. The VirtAddr field tells us where the segments will be located, Flags tells us the permission bits of each memory segment, and the Type field tells us exactly what that segment is used for.
Isn’t it surprising that there are so many program headers our simple C++ program? Let’s analyze what types each of these headers point to and why they’re needed.
PHDR
This segment usually contains no sections.
PHDR stands for “Program HeaDeR”, and is a bit of a strange one. According to the official linux documentations here, it says:
… specifies the location and size of the program header table itself, both in the file and in the memory image of the program.
Why do we need to know where the program table is? Why don’t we just remove this metadata during runtime?
Simply stated - we want to know where the executable begins. The program table which includes PHDR itself could be relocated anywhere in memory if it was a PIE(position independent executable). To compute the location of the executable, we subtract the location where the header exists with the VirtAddr field it claims it’s in. Here’s the source code in libc:
...
case PT_PHDR:
    /* Find out the load address.  */
    main_map->l_addr = (ElfW(Addr)) phdr - ph->p_vaddr;
    break;
...
Here, phdr is the location of the actual header, and ph->p_vaddr is the field VirtAddr deserialized from the ELF file. By subtracting, we have the base location of the executable, which we can use to find where some_segment lives in memory by main_map->l_addr + some_segment->p_vaddr. Credits to the writer of musl, which is a libc implementation.
INTERP
This segment usually contains one section: .interp
This specifies where the interpreter is for loading shared library executables, and we even see the metadata tag [Requesting program interpreter: /lib64/ld-linux-x86-64.so.2] in the program header.
What does this ld-linux thing do?
Thankfully, it is an executable with a very helpful help section. Let’s call it and see what it says:
❯ /lib64/ld-linux-x86-64.so.2
Usage: ld.so [OPTION]... EXECUTABLE-FILE [ARGS-FOR-PROGRAM...]
You have invoked `ld.so', the helper program for shared library executables... This helper program loads the shared libraries needed by the program executable, prepares the program
to run, and runs it.  You may invoke this helper program directly from the command line to load and run an ELF executable file; this is like executing that file itself, but always uses this helper program from the file you specified, instead of the helper program file specified in the executable file you run.
TL;DR: ld.so is the dynamic loader. Programs that load shared libraries will invoke this dynamic loader to load the shared library executable. You usually don’t call this yourself, but you can. It’s like an exec.
We will be analyzing this in more detail later in the blog.
LOAD
This segment can contain many different sections, and there are multiple LOADs per program. Some commonly occurring sections include .interp .init .text .fini .dynamic .got .got.plt .data .bss
This is the most important segment for a typical C++ program. It basically tells the linker to allocate a particular segment of memory with particular permissions. In the above, we see that there are 4 LOAD sections. This only happens for the newer versions of ld(the static linker).
Why do we need 4 sections?
We need different sections because two sections may need different permissions, and/or serve completely different purposes. These segments in C++ are for the following purposes(roughly):
.text, which holds the code to be executed. This should be in theR Esection..rodata, which means read-only data. This usually holds static constants that are used in the program. This is in one of theRsections..data, which is read/write data. This is in theRWsection. There’s no execute because of buffer overflow security vulnerabilities leading to execution of code in the data section. In addition, we have.bssin this section as well. The name doesn’t really mean too much now - you should just consider it as “zero-initialized data”. It contains global variables and static variables that are zero-initialized. The reason this segment exists is for space optimization in the executable itself. (Imagine a lot of zero buffers adding space to the executable’s size)- The ELF header information is in the other
Rsection.
The kernel is responsible here to memory map these segments into our runtime and set up our execution environment involving the stack, heap, our code, etc. Without this section, we would not have executables.
It’s also important to note that the union of all sections within a segment may not be the entire segment itself. For example, programming constructs like our stack and heap belong to the LOAD segment but it may not live in any of the sections within LOAD.
DYNAMIC
This segment usually contains one section: .dynamic
If this executable requires dynamic linking, this field will point to us exactly what information is required. The .dynamic section in the ELF file shows you what shared libraries are required.
How do we find the required shared libraries in the ELF file?
To view that information, run:
❯ readelf -d main

Dynamic section at offset 0x2e20 contains 23 entries:
  Tag        Type                         Name/Value
 0x0000000000000001 (NEEDED)             Shared library: [libstdc++.so.6]
 0x0000000000000001 (NEEDED)             Shared library: [libm.so.6]
 0x0000000000000001 (NEEDED)             Shared library: [libgcc_s.so.1]
 0x0000000000000001 (NEEDED)             Shared library: [libc.so.6]
...
In reality, you don’t need to do this - instead, use ldd to find the dependencies yourself:
❯ ldd main
	linux-vdso.so.1 (0x00007fff23f7a000)
	libstdc++.so.6 => /usr/lib/libstdc++.so.6 (0x00007ff8ae1cc000)
	libm.so.6 => /usr/lib/libm.so.6 (0x00007ff8ae086000)
	libgcc_s.so.1 => /usr/lib/libgcc_s.so.1 (0x00007ff8ae06c000)
	libc.so.6 => /usr/lib/libc.so.6 (0x00007ff8adea6000)
	/lib64/ld-linux-x86-64.so.2 => /usr/lib64/ld-linux-x86-64.so.2 (0x00007ff8ae3d9000)
As a follow-up, why does ldd tell us we have two more shared libraries than the ELF file?
ldd tells us there are 2 more dynamic dependencies, namely linux-vdso.so.1 and /lib64/ld-linux-x86-64.so.2. These two are actually shared libraries that the kernel automatically maps into the address space of all user-space applications. vdso stands for “Virtual Dynamic Shared Object”, and contains many utilities such as getting the current timestamp, which would be expensive if we were to jump to kernel-space to execute. The other shared library is the (in)famous dynamic linker. It is responsible for loading other shared objects into the main runtime’s memory space.
Linker issues are the biggest headaches and they often involve rpath, runpath, LD_LIBRARY_PATH, and other variables that may or may not be baked into the .dynamic section of the ELF file. Knowing how this segment works is crucial to debugging many of the common linker errors. I highly recommend this blogpost if you’re running into a practical issue with dynamic linking .so files. It’s out of the scope of this blog.
NOTE
This segment sometimes contains the sections: .note.gnu.build-id .note.ABI-tag, but it varies.
This is a very free-style section used by vendors or engineers to mark an object file with special information. This information is usually used to check for compatibility. A note segment is fairly small and we don’t really need to care much about this.
GNU_EH_FRAME
This segment usually contains one section: .eh_frame_hdr
In here, EH stands for exception handling. This is a sorted data structure that handles exceptions. It maps particular exceptions to particular function handlers, and helps with frame unwinding for those nice backtraces you get with bt in gdb.
GNU_STACK
This segment usually contains no sections
This is a lightweight header that tells us what permissions we gave the stack. The stack in general should not be executable for security vulnerabilities, so let’s see whether our binary is safe with scanelf:
❯ scanelf . -e
 TYPE   STK/REL/PTL FILE
ET_EXEC RW- R-- RW- ./main
We don’t allow execution on the stack - good news!
GNU_RELRO
This segment usually contains the sections .dynamic .got and sometimes .init_array .fini_array
This particular section is purely for protection against security vulnerabilities. ELF binaries have two maps called the Global Offset Table, otherwise known as GOT, and the Procedure Linkage Table, otherwise known as PLT.
What does the GOT and PLT do?
The GOT stores the exact address of global variables, functions and other symbols from a dynamically loaded shared library. These values in the GOT are subject to change when you re-compile the same program. When calling a function from the shared library, there may be many functions that are never called. To reduce the function resolution overhead, we create stubs in GOT for lazy loaded functions. The steps to resolve a lazy loaded function in runtime is outlined below:
- User calls a lazy loaded function from a dynamically loaded library. This is an entry in the GOT (fixed, unlike the address of the actual function).
- If the function is unresolved, stub code in the section jump to the PLT, where it redirects the call to the dynamic linker’s
_dl_runtime_resolveroutine. _dl_runtime_resolvepopulates the GOT section with the correct address of the function.- The address of the function is used.
- Upon further invocation of the function, the GOT no longer needs to jump to the PLT, and immediately gives the address of the function.
The PLT and GOT are super important, and we need to stop malicious users from messing with it. RELRO in this case stands for RELocation Read Only. These in-memory structures are read-write in order to save the resolved addresses of the loaded functions, but that lends itself to security vulnerabilities. What if the user can buffer-overflow and change the entry in the GOT to execute a function containing arbitrary code?
Well, one way is to make the function information loading all eager, and then turn the section read-only before the user can screw around with the GOT. Before user code can be executed, if the GOT is already populated then turning this section read-only with the system call mprotect will prevent any vulnerabilities. Similar things are done for the dynamic section and the .init_array and .fini_array sections which we’ll discuss in the Assembly dump section.
Recap
So now that we’ve seen what each of these types of segments are used for, let’s recap:
- The ELF header contains metadata about the program.
- Each segment is mapped to memory somewhere. Two segments may overlap if they are not both of type
LOAD. This is how sections may live in two segments. LOADis the most important part of our program. It’s directly mapped into memory with the relevant permissions.- We load the dynamic linker into the
DYNAMICsegment to load shared objects. - We have particular segments like
GNU_RELROandGNU_STACKfor security.
Below is a diagram for clarity:
What does g++ do?
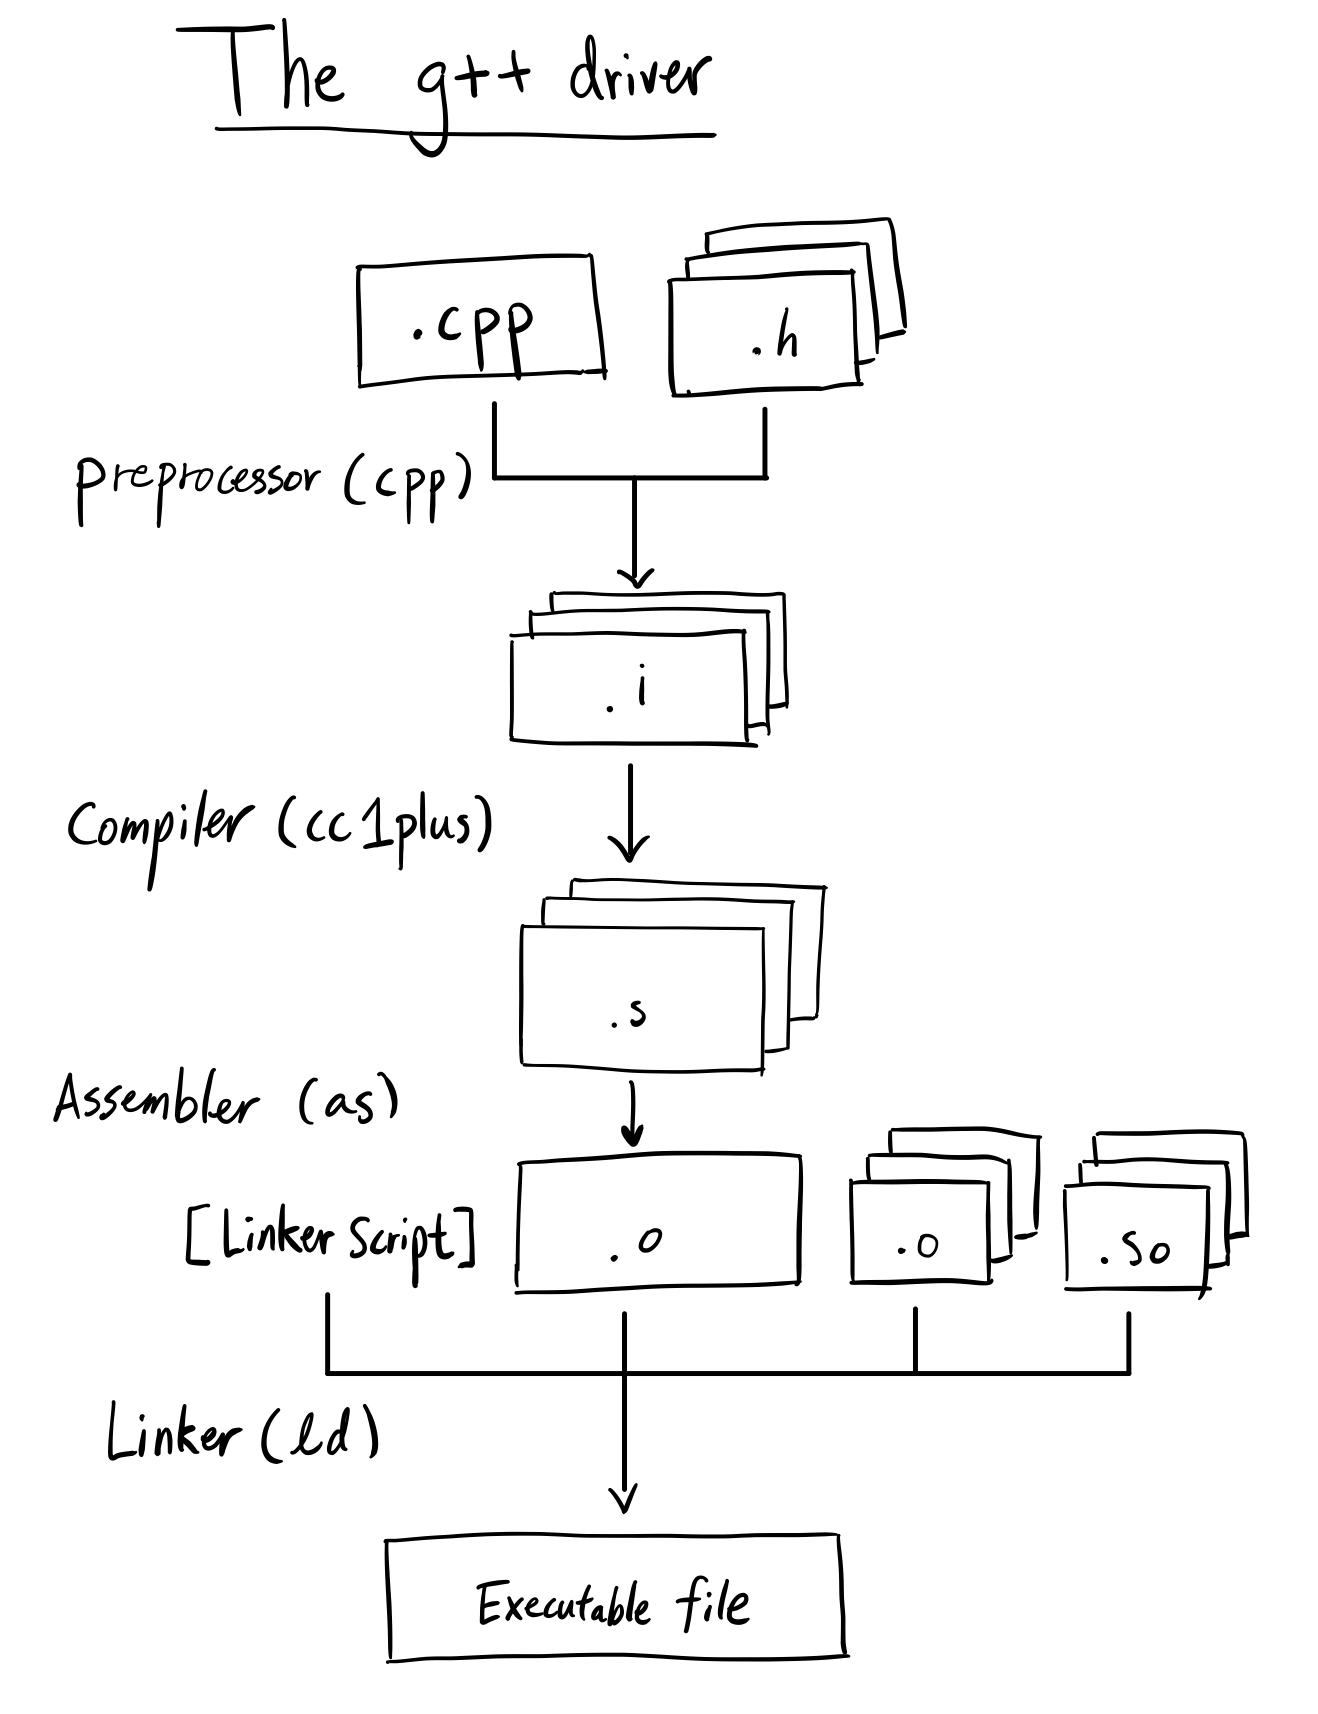
Our goal for this section is to illustrate the different steps in turning our main.cpp file into main the executable.
To make this clear, g++ is not a compiler. A C++ compiler’s job is to read C++ code and generate the proper assembly instructions(or some intermediate language like llvm) and create the translation units (.o’s). If g++ only created .o’s, we would not be able to execute anything g++ creates for us. Then what is g++?
g++ is actually a thin wrapper that dispatches multiple different tools including preprocessors, compilers, and linkers to create whatever you want, whether it be .o’s, .so’s, or executables. If you say “g++ compiler”, people will assume you mean cc1plus, but don’t think that g++ itself is a compiler!
Preprocessor (cpp)
The preprocessor in the context of C++ is something that takes your macros and turns them into actual values before feeding the resulting C++ program to a compiler. This also includes the #include directive for header files. It would usually take something like this:
// Output:
// ❯ cpp main.cpp (can also invoke with g++ -E main.cpp)
// ...
// int x = 1;
//
// int main() {}
#define MACRO
#ifdef MACRO
int x = 1;
#else
int y = 0;
#endif

int main() {}
This is the simplest part of the workflow for creating an executable.
Compiler (cc1plus)
The compiler is such a complicated beast that I can’t possibly talk about it in detail in this post(nor do I have the expertise to talk about the C++ compiler in detail).
The part of g++ that actually compiles things is called cc1plus, and it generates assembly code from C++ code. This particular compiler is broken up into 3 logical sections - the “front end”, “middle end”, and the “back end”. For a simple program like ours, we can go through each part and see how our simple source code compiles into assembly.
Front End
The front end of the cc1plus compiler takes in C++ code, and transforms it into an abstract syntax tree, or AST. The AST is the semantic representation of our code in a tree-like format. The entire program is the root of the node, and different entities like function definitions, global variable declarations and other statements in the global scope are the children of the root node, and it follows recursively until we reach a primitive token like an identifier or a literal value.
On clang, we are able to compile C++ programs and obtain a .dot file detailing the AST it builds during compilation. The int main() {} program isn’t very exciting…
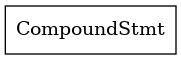
The definition for main is considered a CompoundStmt, and we have nothing inside the definition, so that’s it for the AST. So let’s look at a slightly more complicated program to see an example of what the AST looks like in general:
int main() {
    int x = 3;
    int y = 3 + x;
    return y;
}
Pretty simple - we return the value 6. However, the AST that includes these symbols tell us a lot about the structure:
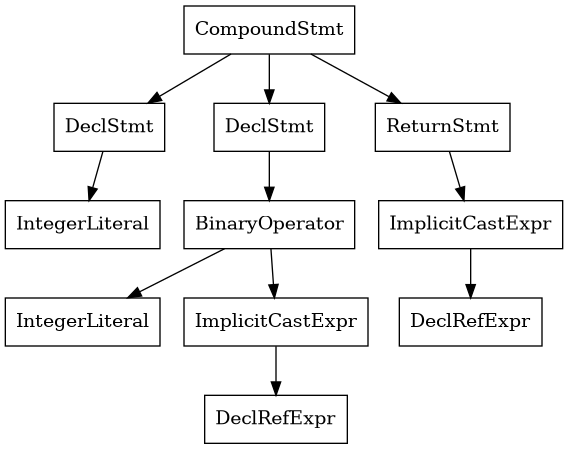
What does the above AST tell us?
As you can see, since we have two declarations of int types, we have two nodes called DeclStmt, and 3 is a IntegerLiteral type, which is a token that cannot be expanded to further symbols. The second branch adds the variable x and a literal together, and we first implicitly cast the variable x (which is a DeclRefExpr) even though it’s of the same type. We also have a return statement which returns the DeclRefExpr corresponding to y. The tree is traversed by the compiler to eventually generate assembly code according to these instructions.
As far as I know, you can’t create a viewable AST from g++. However, we can get the control flow of the program and visualize it. To create the control flow for this program, use the -fdump-tree-all-graph mode during compilation and you’ll get a ton of .dot files which you can visualize with graphviz. Here’s our flow graph for int main() {}:
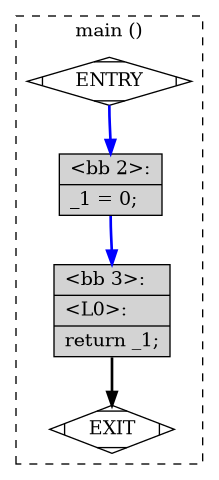
What is this language? We’ll see that the code in each block is called GIMPLE, a language used for the middle end section. This language is fairly simple to read for our application, and we can see it returns 0 even though we put nothing in the body. This is generated by the compiler in the special case of main according to the standards:
If control reaches the end of main without encountering a return statement, the effect is that of executing
return 0
Cool! So now we know that the compiler creates a flow graph and an AST. What happens next?
Middle End
The middle end of cc1plus is arguably the biggest and most important part. It’s often working with an intermediate representation that is neither C++ nor assembly. It needs this extra step of compilation in order to make powerful optimizations. As mentioned, the middle end’s language is called GIMPLE (a subset of language called GENERIC), a language which involves max 3 operands in a single expression. Merrill’s paper on GIMPLE explains the transformation from C++ to GIMPLE for some basic operations (Merill, 2003). Here’s our simple program in GIMPLE:
main ()
{
  int D.2067;

  D.2067 = 0;
  return D.2067;
}
Well… that’s a bit boring, can you give a more interesting example?
Let’s take a look at what GIMPLE can actually do, by using two basic rules in an example:
Any expression involving more than 3 operands is broken up:
a = b + c + d;
--- Turns into ---
T1 = b + c;
a = T1 + d;
Conditional unary expressions are explicitly transformed into if-else statements:
a = b ? c : d;
--- Turns into ---
if (b)
    T1 = c;
else
    T1 = d;
a = T1;
Let’s look at an example of these rules:
int main() {
    int x = 3;
    int y = 3;
    int z = (x == y) ? x + y + 3 : x - y - 3;
}
We’re gonna need at least three temporary variables - one to break up the compound statement x + y + 3, one to break up the compound statement x - y - 3, and another to act as temporary for the unary statement’s value to assign to z. If we dump the GIMPLE representation for this (the .gimple file can be found in the entire dump from -fdump-tree-all-graph), we see the following:
main ()
{
  int iftmp.0;
  int D.2074;

  {
    int x;
    int y;
    int z;

    x = 3;
    y = 3;
    if (x == y) goto <D.2071>; else goto <D.2072>;
    <D.2071>:
    _1 = x + y;
    iftmp.0 = _1 + 3;
    goto <D.2073>;
    <D.2072>:
    iftmp.0 = 3;
    <D.2073>:
    z = iftmp.0;
  }
  D.2074 = 0;
  return D.2074;
}
As you can see, the unary operator decayed into an if else statement with goto’s, and we use three temporaries. _1 is used to compute an intermediate value in the expression x + y + 3, _2 is used to compute an intermediate value in the expression x - y - 3, and iftmp.0 is a variable used to hold the values of either branches to be assigned to z. We actually need one more variable, D.2074 to return a value of 0 for our main function.
GIMPLE is a simple language which allows for powerful optimizations. The simpler the language, the more optimization rules can be applied in general, and that’s one of the reasons for C++’s blazing fast performance.
NOTE: The middle end doesn’t only contain GIMPLE, but rather many other intermediate representations. This is a simplification.
Back End
The back end for cc1plus is responsible for taking whatever intermediate representation the middle end gives it, and generating a series of languages that follow the rules of the target architecture. This means producing code that starts to look more and more like ARM, MIPS, or x86, which are the destination languages. In this phase, we need to start caring about the fact that we have finite number of registers, and arbitrary number of variables. This is a whole topic in itself, called register allocation. We won’t discuss it in detail here.
Assembler (as)
What we generate from cc1plus is not actually code that our computers can run. There’s a difference between assembly language and machine code! Machine code is represented as binary and is unreadable to humans. It’s usually the lowest level of language we work with until we play with circuits ourselves, since it can be read directly by the CPU to do instructions. Here’s an example of assembly that’s “readable”:
# AT&T syntax
push 0x0 # Push value 0 on the stack
mov  0x0, %eax # Move value 0 into register eax
And the corresponding machine code(in hex):
6a 00
b8 00 00 00 00
The latter is what we’ll have in the final executable.
So after we compile our C++ code to assembly language, the assembler should give us machine code right?
Almost but not quite! There is actually another intermediate language that is a layer above machine code - object code. This is actually what assembler outputs. Object code is basically machine code that lives inside of an object file, with jump addressing parametrized for the linker to fill in. In position independent executables(pie), we don’t know the absolute address of our jmp instructions in individual translation units so it’s the static linker’s job to fill this in and turn it into actual machine code.
Static Linker (ld)
After we generate the object code from as, organization of the memory space needs to be done. If we have multiple translation units (think of them as .o’s or static libraries), how are we going to piece them together into a single executable? Well, that’s the job for ld!
Disclaimer: Static linker and dynamic linkers are NOT the same thing!
As you might have remembered from the .DYNAMIC section of the ELF file, we list a couple of needed dynamic dependencies. This is a job for the dynamic linker, to run those dependencies somewhere in memory during runtime. The static linker is responsible for organizing a ton of object files and static libraries into a single executable. They are NOT the same! The final executable ONLY has the path of the dependencies for the dynamic linker(literally a few strings), but it has the sections, code, everything from translation units for the static linker.
Usually, ld is considered the static linker. ld.so is the dynamic linker. Don’t get them mixed up!
You may be asking - why do we need two different types of linkers? Can’t we just have the static linker pull in all dependencies and create a standalone executable, or have the dynamic linker load all dependencies at runtime?
Yes - theoretically if every library you ever needed existed in both the static form (.lib, .a), and the shared form (.so), then you could have a 100% statically linked or 100% dynamically linked executable. But what practical issues arise from this?
If we statically link everything, including the standard library, we would be pulling in a lot of code to compile. Your executable will turn out to be orders of magnitude larger than you originally expected. To run this on a computer with memory/disk constraints would be very difficult. In addition, libraries under active development constantly improve with new features with minimal disruption to the user interface. If you wanted to use the newer version of any library, you’d have to compile the entire program again! There are also some things you just cannot do with static linking, like the LD_PRELOAD trick to replace system calls to the kernel, which requires dynamic linkage.
On the other hand, dynamic linking is a huge nightmare with dependencies. You may have a slim executable with minimal code bloat, but everytime you wanted to run your executable on a brand new environment, you require all of your dynamically linked libraries to exist. On top of that, they need to be in the same discovery path, which is a convoluted set of rules involving environment variables and baked-in paths during compilation. In addition, a key turn-off for dynamic linking is how slow it is. In an adequately performant system, the fact that dynamically linked libraries require an indirection through the GOT/PLT could be costly. In addition, the compiler doesn’t have the full picture of your procedures (all it has is the name of your shared library), so it can’t make assumptions and propagate optimizations as it would with a static library. For financial firms, this is a dealbreaker.
The static linker reads a set of instructions in the linker script, which is a file written in a special language made only for ld.
How do we view the linker script for our simple program? (Example)
If we use the below flags with verbose linkage, we’ll see the linker script actually being emitted (major parts redacted) in the g++ driver:
❯ make linker
g++ -O0 -fverbose-asm -no-pie -o /dev/null -x c main.cpp -Wl,--verbose
...
using internal linker script:
==================================================
...
OUTPUT_FORMAT("elf64-x86-64", "elf64-x86-64", "elf64-x86-64")
OUTPUT_ARCH(i386:x86-64)
ENTRY(_start)
SEARCH_DIR("/usr/x86_64-pc-linux-gnu/lib64"); ...
SECTIONS
{
  ...
  .interp         : { *(.interp) }
  ...
  .rela.dyn       :
    {
      *(.rela.init)
      *(.rela.text .rela.text.* .rela.gnu.linkonce.t.*)
      ...
      *(.rela.lrodata .rela.lrodata.* .rela.gnu.linkonce.lr.*)
      *(.rela.ifunc)
    }
  ...
  .plt            : { *(.plt) *(.iplt) }
  .plt.got        : { *(.plt.got) }
  .plt.sec        : { *(.plt.sec) }
  ...
  .init_array    :
  {
    PROVIDE_HIDDEN (__init_array_start = .);
    KEEP (*(SORT_BY_INIT_PRIORITY(.init_array.*) SORT_BY_INIT_PRIORITY(.ctors.*)))
    KEEP (*(.init_array EXCLUDE_FILE (*crtbegin.o *crtbegin?.o *crtend.o *crtend?.o ) .ctors))
    PROVIDE_HIDDEN (__init_array_end = .);
  }
  .fini_array    :
  {
    ...
  }
  ...
}
As expected, the linker script tells us at the beginning that we are generating a 64-bit ELF file made for the 64 bit architecture. Upon execution of the program, we start at a symbol called _start, and our shared objects are found in the SEARCH_DIR paths(which can be modified by the rpath or runpath variables during compilation). Then, the linker script describes exactly how the sections are laid out in our executable.
Understanding the syntax for the linker script is actually not too hard. The most important part of a linker script is in the SECTIONS block. Each scope explains the organization of a particular section. If we recall in the ELF header section, we need to put our interpreter information somewhere in memory, and each object file may have their own interpreter information. Where are we going to put our .interp section in the final executable? It usually looks like this in the linker script:
.interp : { *(.interp) }
This is saying the .interp section is laid out by all the .interp sections the linker was able to find (in the other shared libraries) in some sequence. The * matches all section definitions found and the (.interp) selects that particular section specification.
Let’s look at a slightly more complicated example (taken from the above generated linker script):
.rela.dyn       :
    {
      *(.rela.init)
      *(.rela.text .rela.text.* .rela.gnu.linkonce.t.*)
      ...
      *(.rela.lrodata .rela.lrodata.* .rela.gnu.linkonce.lr.*)
      *(.rela.ifunc)
    }
Similarly, we see the .rela.dyn section being defined by all of the .rela.init sub-sections first, and then the .rela.text sections laid out after. The reason the linker did not say .rela.dyn : { *(.rela) } is because it would’ve been laid out without the subsections (like rela.init) being grouped together.
Then, we see the PLT sections along with the GOT being laid out with .plt, .plt.got and .plt.sec sections defined in the example linker script above.
Then, we see two sections that we weren’t familiar with before - .init_array and .fini_array. These are actually calling the global constructors for statically initialized objects before the first line of code in main is actually executed, and calling the destructors for the same object upon exit of the main function. Within each translation unit (by definition, a single .c/.cpp file with all of the header files included) we will have .init_array sections containing global constructors.
Recall my blogpost from a while back, where I said you can’t have static constructors that depend on each other across translation units. This is because the linker can choose to order the calls of global constructors in whichever way it wants. Calling another static variable’s methods during static construction will give you undefined behavior unless you can go into the linker script and force a translation unit to be compiled first. (Or, just don’t do something so stupid)
Recap
So what did we learn about the g++ driver?
g++is composed of 4 main parts - the preprocessor, the compiler, the assembler and the linker.- The preprocessor replaces macros in our C++ program into actual values.
- The compiler uses a set of rules to traverse through our source code and generate the assembly code using the semantics of our program. It’s super complicated.
- The assembler takes the assembly code and generates object code (not machine code).
- The linker gets instructions via the linker script to group our sections in the ELF object files in a particular organization to create an executable.
Below is a diagram for clarity:
Now that we’ve understood what g++ does roughly, let’s actually look at the emitted assembly code placed in these sections!
Analyzing Generated Procedures: Objdump
Our goal this section is to understand what procedures are generated from the compiler, what they’re used for, and in what order they are executed.
The objdump command quite literally dumps an object file’s information. The command I used is in the Makefile above and can be invoked by make dump. For such a small program, we have a surprising amount of sections to analyze. However, all of them are important.
main - The dumb and obvious
Let’s see the most obvious function that we were expecting: the main function.
0000000000401106 <main>:
# Push prev. caller addr into stackframe
  401106:	55                   	push   rbp
# Put current stack frame into rbp
  401107:	48 89 e5             	mov    rbp,rsp
# Put return code 0 into eax
  40110a:	b8 00 00 00 00       	mov    eax,0x0
# Get caller addr
  40110f:	5d                   	pop    rbp
# Return function
  401110:	c3                   	ret
# The next two lines are multi-byte no-ops for padding.
  401111:	66 2e 0f 1f 84 00 00 00 00 00 	nop    WORD PTR cs:[rax+rax*1+0x0]
  40111b:	0f 1f 44 00 00       	nop    DWORD PTR [rax+rax*1+0x0]
Nothing too fancy here - the function returns a literal value of 0 and does nothing else. Let’s find the more interesting sections of the assembly dump and analyze them.
_start - True start of the program
Disassembly of section .text:

0000000000401020 <_start>:
# Same end branch instr as above
  401020:	f3 0f 1e fa          	endbr64
# sets ebp to 0
  401024:	31 ed                	xor    ebp,ebp
  401026:	49 89 d1             	mov    r9,rdx
# Takes the top of the stack (argument), which is `argc` for C++.
# Pop also causes rsp to increase by 8 bytes (stack grows from high to low)
  401029:	5e                   	pop    rsi
# Moves `argv` pointer value into rdx.
  40102a:	48 89 e2             	mov    rdx,rsp
# Forcibly grow the stack a bit.
  40102d:	48 83 e4 f0          	and    rsp,0xfffffffffffffff0
# pushes:
# - argc
# - argv
# - aligned stack ptr
# - garbage registers
# ... as arguments before calling __libc_start_main
  401031:	50                   	push   rax
  401032:	54                   	push   rsp
  401033:	49 c7 c0 90 11 40 00 	mov    r8,0x401190 # addr of __libc_csu_fini
  40103a:	48 c7 c1 20 11 40 00 	mov    rcx,0x401120 # addr of __libc_csu_init
  401041:	48 c7 c7 06 11 40 00 	mov    rdi,0x401106 # addr of main
  401048:	ff 15 9a 2f 00 00    	call   QWORD PTR [rip+0x2f9a]        # 403fe8 <__libc_start_main@GLIBC_2.2.5>
  40104e:	f4                   	hlt
  40104f:	90                   	nop
This is the first function in .text and is the first function the program executes. Basically, _start prepares the system to call the __libc_start_main function, which takes in the following arguments:
int __libc_start_main(int *(main) (int, char * *, char * *),
                      int argc,
                      char * * ubp_av,
                      void (*init) (void),
                      void (*fini) (void),
                      void (*rtld_fini) (void),
                      void (* stack_end));
Which seems to line up with the arguments the assembly code is preparing prior to calling the function. The pattern of moving arguments into registers and overflowing onto the stack via push is done here with the ubp_av variable, which looks at argv on the stack.
Why is this _start function in our binary? We never declared it!
You might be curious why this _start along with many other symbols we’ll inspect is included in our executable. These assembly instructions are created in an object file called crt1.o or crt0.o, which stands for “C Run Time”. Depending on your operating system and compiler, you may get either of the two (but not both). These are linked statically with all C and C++ executables as a bootstrapping mechanism to start the program. You can actually bypass the startup code if you pass in the flags -nostdlib -nostdinc, which removes all standard C libraries (including the runtime library).
We also see the functions __libc_csu_fini and __libc_csu_init pointers being moved into registers as callee-side arguments into __libc_start_main. What are these?
__libc_csu_init and __libc_csu_fini - Program level ctor/dtor handlers
Since these functions are fairly large, I’m too lazy to analyze them line-by-line. They basically do the construction and destruction handling as a program. We can register a list of constructors to be called by __libc_csu_init and similarly destructors with __libc_csu_fini. We can’t actually dump the contents of __libc_start_main since it lives in the libc shared library, but we can assume the execution order is:
- Call
__libc_csu_initfor the program level constructor handling - Call
main - Call
__libc_csu_finifor the program level destructor handling
What is a program destructor? And how do I use it in C++?
Let’s see the program level constructors and destructors in action. Let’s write a simple program with functions with global constructor and destructor attributes:
void __attribute__ ((constructor)) dumb_constructor(){}

void __attribute__ ((destructor)) dumb_destructor(){}

int main() {}
And now I will use gdb to show you that they’re being called here. We see that dumb_constructor is being called by the init function:
Breakpoint 1, dumb_constructor () at main.cpp:1
1	void __attribute__ ((constructor)) dumb_constructor(){}
(gdb) bt
#0  dumb_constructor () at main.cpp:1
#1  0x000000000040116d in __libc_csu_init ()
#2  0x00007ffff7abcfb0 in __libc_start_main () from /usr/lib/libc.so.6
#3  0x000000000040104e in _start ()
… And that dumb_destructor is being called by the fini function:
Breakpoint 1, dumb_destructor () at main.cpp:3
3   void __attribute__ ((destructor)) dumb_destructor(){}
(gdb) bt
#0  dumb_destructor () at main.cpp:3
#1  0x00007ffff7fe242b in _dl_fini () from /lib64/ld-linux-x86-64.so.2
#2  0x00007ffff7ad4537 in __run_exit_handlers () from /usr/lib/libc.so.6
#3  0x00007ffff7ad46ee in exit () from /usr/lib/libc.so.6
#4  0x00007ffff7abd02a in __libc_start_main () from /usr/lib/libc.so.6
#5  0x000000000040104e in _start ()
… Wait, it’s not? Bewildered, I took to StackOverflow and asked why this is happening. It seems like in the libc code, the __libc_csu_fini function is essentially deprecated with the comment:
/* This function should not be used anymore.  We run the executable's
   destructor now just like any other.  We cannot remove the function,
   though.  */
void
__libc_csu_fini (void) { ... }
To find out why historically we used __libc_csu_fini but now we delegate to _dl_fini is another rabbithole in itself, and I decided to stop my investigations there.
One thing I thought was interesting from breakpointing __libc_csu_init was that it actually called a function _init first before calling our dumb_constructor() function. What is this function?
_init and _fini - Obsolete program level ctor/dtor with highest priority
Disassembly of section .init:

0000000000401000 <_init>:
# Stands for End Branch (64 bits).
# When an indirect jump occurs, it must jump to an endbr64 instruction
# or else an exception occurs. This is a part of
# CET(Control-flow Enforcement Tech) to prevent buffer-overflow
# or gadget exploits on return addresses.
  401000:	f3 0f 1e fa          	endbr64
  401004:	48 83 ec 08          	sub    rsp,0x8
# Checks to see whether __gmon_start__ exists. This symbol doesn't exist in our
# code, because we don't have gmon profiling enabled(used for gprof)
  401008:	48 8b 05 e1 2f 00 00 	mov    rax,QWORD PTR [rip+0x2fe1]        # 403ff0 <__gmon_start__>
# Jumps if %rax is equal to 0. Test does an AND operation.
  40100f:	48 85 c0             	test   rax,rax
  401012:	74 02                	je     401016 <_init+0x16>
# If we don't jump, then we call the __gmon_start__ function which does
# some intrusive profiling setup.
  401014:	ff d0                	call   rax
  401016:	48 83 c4 08          	add    rsp,0x8
  40101a:	c3                   	ret
This initialization function is at the front of our assembly dump. It seems like it really doesn’t do much other than call the gmon profiling system if it’s defined. Otherwise, it returns.
From looking online, it appears these two functions are actually deprecated, and we shouldn’t use them:
Historically there have been two special functions,
_initand_finithat can be used to control constructors and destructors. However, they are obsolete, and their use can lead to unpredictable results. Your libraries should not use these; use the function attributes constructor and destructor instead.
And this makes sense! We see _init being called from __libc_csu_init, and then our own custom program level constructor being called by __libc_csu_init shortly after. As long as we register our constructors with the attribute, we can feel free to ignore this pair of functions.
register_tm_clones, deregister_tm_clones - Mysterious concurrency model functions
Here’s an abbreviated view of register_tm_clones:
00000000004010c0 <register_tm_clones>:
  4010c0:	be 48 40 40 00       	mov    esi,0x404048
  4010c5:	48 81 ee 38 40 40 00 	sub    rsi,0x404038
  ...
  4010df:	48 8b 05 02 2f 00 00 	mov    rax,QWORD PTR [rip+0x2f02]        # 403fe8 <_ITM_registerTMCloneTable@LIBITM_1.0>
  ...
  4010f8:	c3                   	ret
After going on a scavenger hunt, it appears that tm stands for “Transactional Memory” which is used in multithreading applications, and functions with the prefix _ITM belongs to the libitm component of gcc. Of course, for other compiler flavors it may be called something else. The code for this can be found in gcc but it lacks comments. The deregister_tm_clones function appears to be called by __do_global_dtors_aux:
00000000004010d0 <__do_global_dtors_aux>:
  ...
  4010e1:	e8 7a ff ff ff       	call   401060 <deregister_tm_clones>
  ...
  4010f0:	c3                   	ret
As far as I know, global destructors belong to static objects. But we don’t have any static objects defined as it’s such a barebones C++ program. Where is this tm_clones thing coming from?
The short answer is: It’s a function being called by libgcc.so for transactional memory model in C++. The long answer is in the appendix.
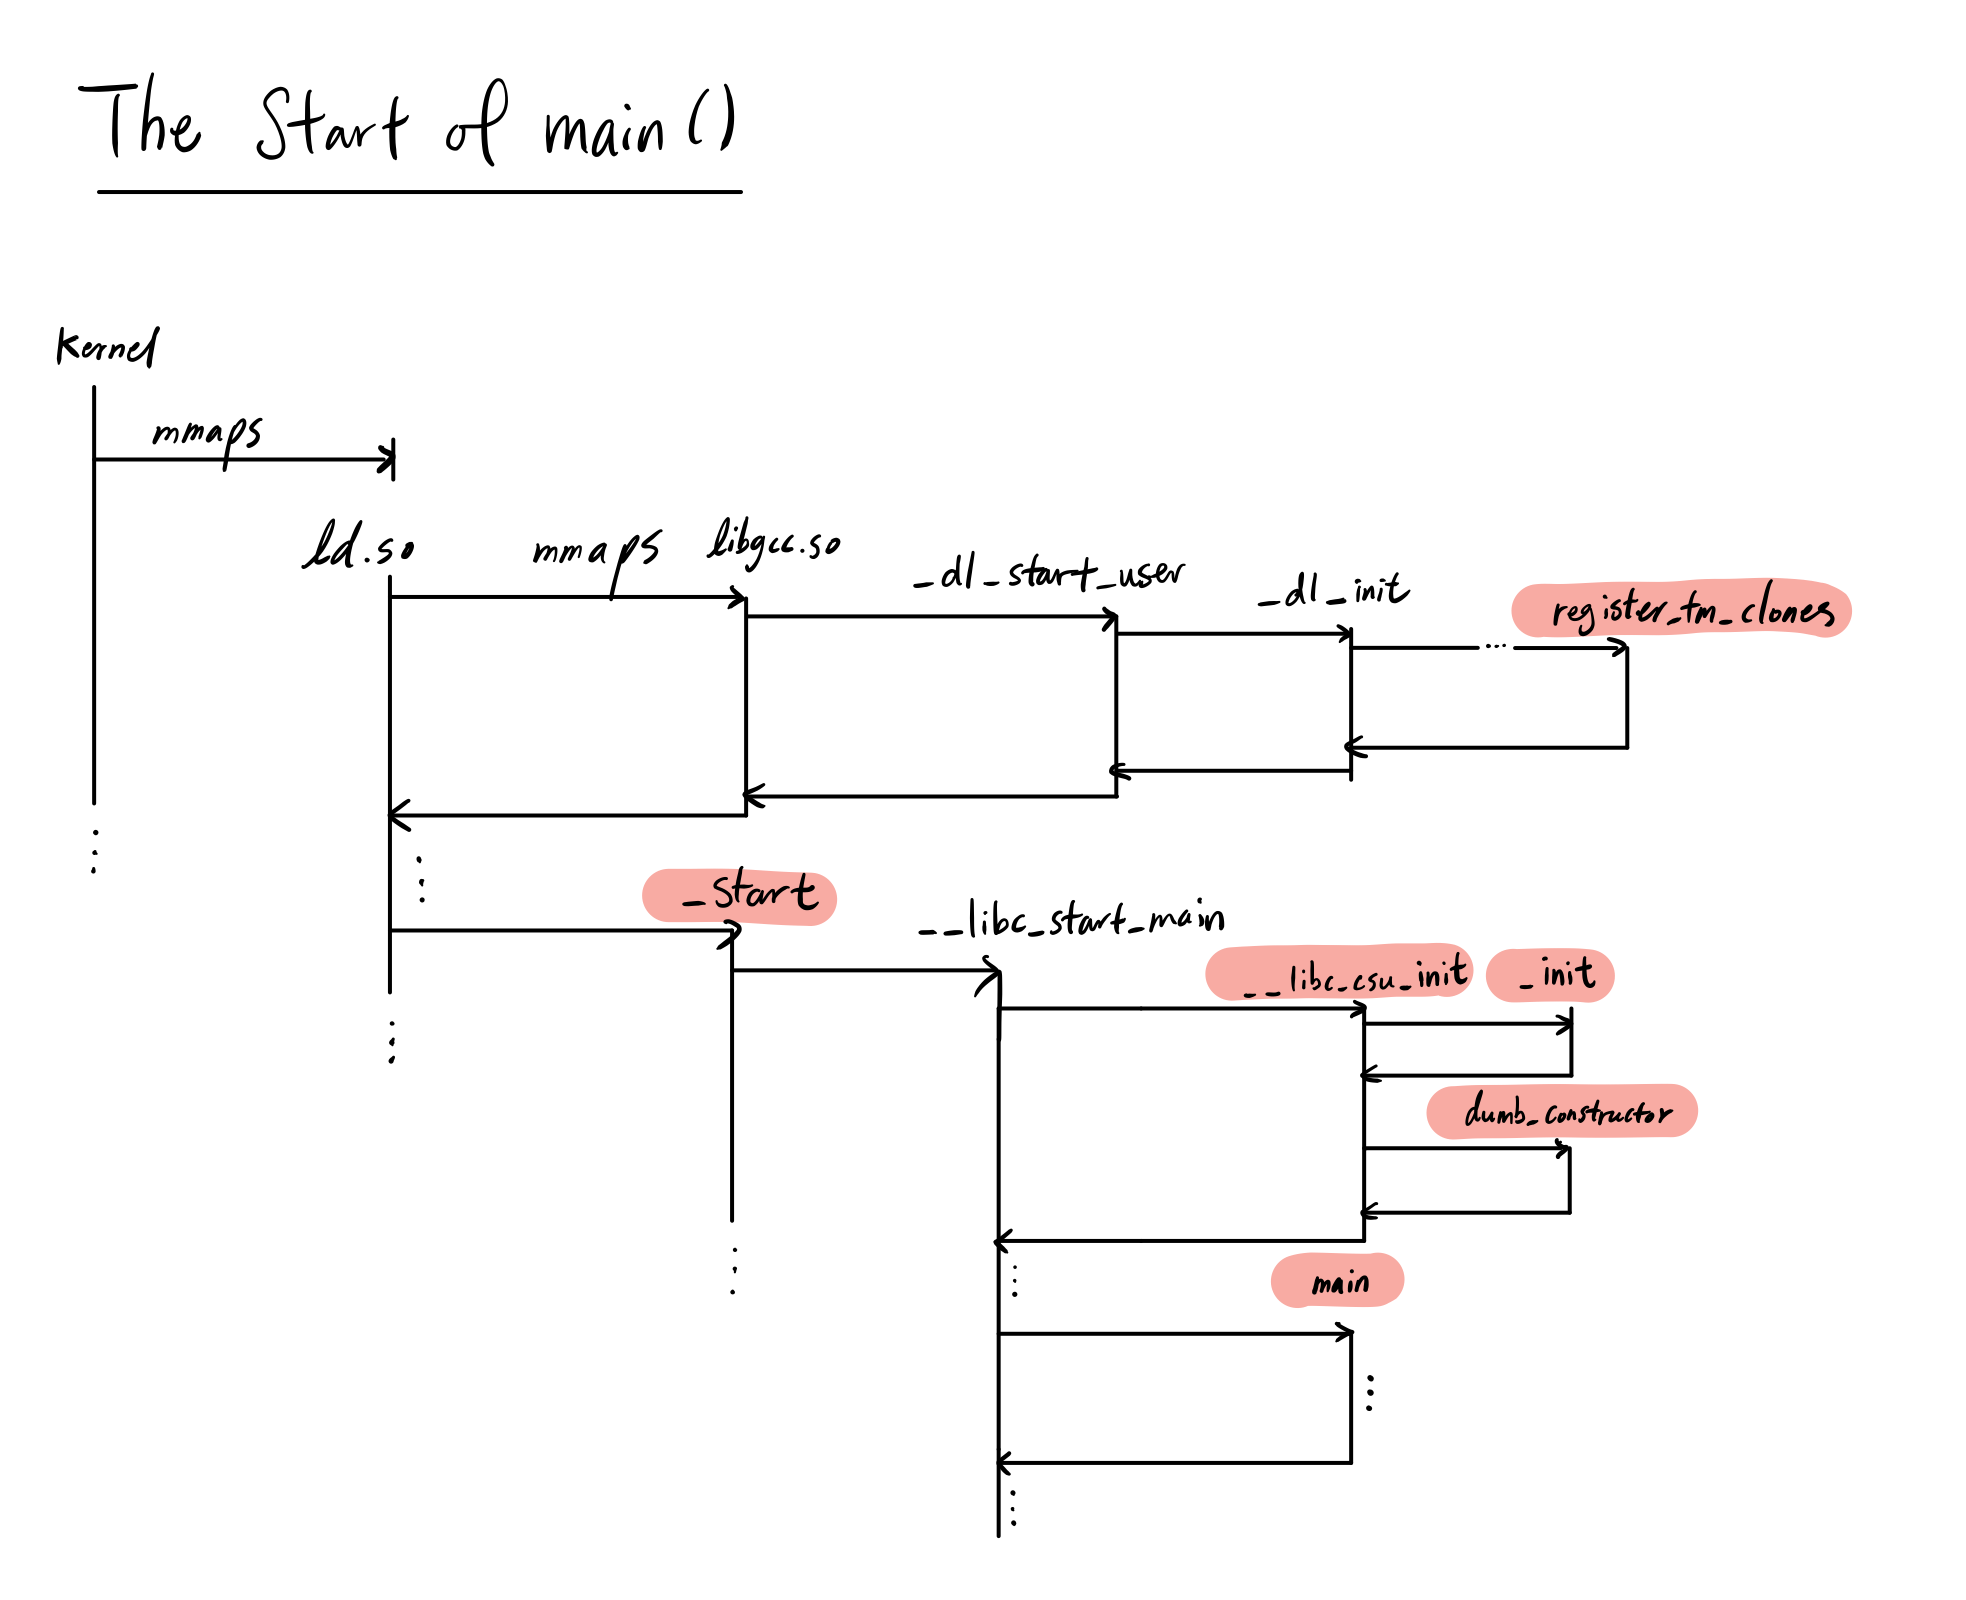
We know that _start is the beginning of our program, but we actually need to run something else first. When the program interpreter field in INTERP is specified, we actually run the dynamic linker ld.so to populate our memory with the shared libraries in the NEEDED section in DYNAMIC. libgcc.so is one of these, and so we start by loading it into memory, and then running some initialization code, which then eventually calls register_tm_clones, and then gives control back to the main executable at the _start function. So technically, register_tm_clones is an example of a function that gets run before the _start function is even called!
Recap
Now that we’ve seen basically all of the important functions generated in assembly, let’s summarize our findings:
mainis boring and expected.- The system starts by calling
_start, which calls__libc_csu_init, then__libc_start_main __libc_csu_initcalls_initfirst, an obsolete global initializer, then our own custom onesregister_tm_clonesandderegister_tm_clonesare a part of the experimental and incomplete transactional memory feature for C++. They register clones of functions that are optimized for concurrent access during runtime.
Let’s see a flow chart of what this is actually doing.
Conclusion
It was an incredibly deep rabbit hole that I dug myself into, but I’m glad I came out with a wealth of knowledge about:
- ELF formats (sections & segments)
- Dynamic linker executable & script
- PLT and GOT (shared objects symbols)
- Libc runtime
- Program constructors and destructors
- Static initialization
- Transaction memory models
- … and more.
I’ve always been interested in diving into these rabbit holes and I’ve learned some of the material in college, through Professor Eggert’s class. If there’s anyone I’d like to thank for sprouting my curiosity in the subjects discussed it would have to be him. Although there’s still many questions, I can confidently say that this investigation has made me less afraid of the mysteries of executables, and I’m excited to delve deeper into more rabbit holes in libc and the gnu packages.
Appendix
Some notes about the cc1plus compiler and general parsing rules
The C++ language has many ambiguous grammar rules which makes some expressions require arbitrary long lookaheads of the next expressions to determine the syntactic meaning of the program. For simple languages that are context-free, $LR(1)$ type parsers can be sufficient (in fact, you can implement parsers for context-free languages by a simple stack), but C++ is not context free, so it requires $LR(\infty)$ parsers to guarantee correctness. In fact, C++ templates itself is turing complete, which means the compiler may terminate with no errors and produce a program that is runnable, or terminate with an error upon parsing, or never terminate. (The “correct” definition involving the Church-Turing thesis is covered in my blog here and here)
template <int A, int B>
int break_my_compiler()
{
    if constexpr(A == B)
        return break_my_compiler<A+1, B+1>();
    return 0;
};

int main() {
    break_my_compiler<1,1>();
}
Try running the above program with -ftemplate-depth=60000 and wait for your CPU to catch on fire.
For a simple C++ program such as ours, involving only int main() {}, we can assume the grammar rules fit something like:
The semantic definition of our program is that there is a function named main that returns int and contains no statements or parameters. The compiler creates some representation of this definition, usually in the form of an Abstract Syntax Tree (AST).
Disclaimer: The cc1plus compiler implementation is miles more complicated than this. This was an example of a grammar that could fit to parse our simple program. I didn’t state the definition of $expr$ since that will require me to add a lot more rules and compilers isn’t really the focus of this blog.
Transactional Memory Model & Clones
Warning: The below is an experimental part of the C++ standard. The contents of this blog is generated from g++-9.
Basically, C++ has its own Transactional Memory Technical Specification, or TMTS, which standardizes what a transaction really means in libitm. In the specification, we have two ways of accessing the transactional memory scope:
// (1)
// Psuedocode. Currently can use with __transaction_atomic
__transaction_atomic {
	x++;
}
// (2)
// Pseudocode. Currently can use with __transaction_relaxed
__transaction_relaxed {
	x++;
    read_file();
}
// (3)
[[optimize_for_synchronized]] char* read_file() { ... }
- Here,
__transaction_atomicblocks are modeled after optimistic concurrency, where upon a check of whetherx’s original values has been modified, it will re-run the block with the new value ofxand scrap any changes to commit to all variables written to. __transaction_relaxedis exactly like howsynchronizedis in Java - a global lock is acquired and the code is executed sequentially in total order until the lock is released. In most cases, C++ code is not transaction safe like file I/O above, so we can’t use atomic and have to fall back to using__transaction_relaxed.- The last feature above is the C++ attribute
[[optimize_for_synchronized]]which has the compiler optimize the functionread_filefor repeated calls within asynchronizedblock (aka, removing the global lock whenever possible).
This is a very promising and interesting feature we should expect to see in the future releases of compilers, but right now it’s still in development. Here’s what we can do with it though:
Atomic transactions
Here, I compile a program with -fgnu-tm to enable the atomic transaction calls:
int hello(int& y) {
    return y + 1;
}

int main() {
    int x = 0;
    // Begin
    __transaction_atomic {
        x++;
    } // End
    x = hello(x);
}
It took me a while to formulate the minimum code required for the libitm calls to kick in (believe me, for some reason that function call to hello was required). This compiles to:
0000000000401187 <main>:
  4011aa:	b8 00 00 00 00       	mov    eax,0x0
  # Begin
  4011af:	e8 bc fe ff ff       	call   401070 <_ITM_beginTransaction@plt>
  ...
  4011c2:	e8 99 fe ff ff       	call   401060 <_ITM_RU4@plt>
  ...
  4011d5:	e8 56 fe ff ff       	call   401030 <_ITM_WU4@plt>
  4011da:	e8 61 fe ff ff       	call   401040 <_ITM_commitTransaction@plt>
  ...
  4011ea:	e8 51 fe ff ff       	call   401040 <_ITM_commitTransaction@plt>
  # End
  ...
  401218:	c3                   	ret
  401219:	0f 1f 80 00 00 00 00 	nop    DWORD PTR [rax+0x0]
It compiles and runs fine. As you can see, we begin the transaction right after mov eax,0x0, which is setting x = 0. The transactional memory block runs and calls a few things involving ITM in the plt, which as we had learned before is a procedural linkage table, pointing to the shared library containing the definition for the functions.
Synchronized transactions
I wanted to confirm for myself that __transaction_relaxed is fully working in g++-9 and we can enforce total order with it with the following program:
#include <thread>
#include <atomic>
#include <iostream>

std::atomic<int> x = 0;

void t1(){
    __transaction_relaxed {
        x = 1;
        std::this_thread::sleep_for(std::chrono::milliseconds(100));
        std::cout << "x is equal to... " << x << std::endl;
        while(x == 0);
    }
}
void t2(){
    // Comment this scope out if you want to see it deadlock
    __transaction_relaxed {
        std::this_thread::sleep_for(std::chrono::milliseconds(1));
        // This will turn x to 0 and t1 will "deadlock"
        std::cout << "x is changed by t2!" << std::endl;
        x = 0;
    }
}

int main() {
    std::thread _t1(t1);
    std::thread _t2(t2);
    _t1.join();
    _t2.join();
}
Here, we have two threads, one of which would set the atomic int to 1, and if total order is assumed, will never enter the while loop. However, threads can modify the value of an atomic variable in any order, and the compiler has the ability to re-order your instructions however it wants unless you state the memory order for loading and storing the atomic (long story, we’ll cover that later). In this case, the second thread would come along and set the value to 0 right before execution of the while loop for the first thread 99% of the time due to sleeps. If we add the synchronized scope, we get the following output and the program exits with no infinite while loop:
❯ ./main
x is equal to... 1
x is changed by t2!
This confirms that libitm is doing its job.
tm clones
So now we know that TM is an experimental transactional memory feature, but what is tm_clones? Well, I compiled another simple C++ program and found out. Here, we use the C++ attribute explained above:
[[optimize_for_synchronized]] int hello(int y){
    return y;
}

int main () {}
What do we get after objdump‘ing it? We see something very surprising:
0000000000401144 <hello(int)>:
  401144:	55                   	push   rbp
  401145:	48 89 e5             	mov    rbp,rsp
...
0000000000401179 <transaction clone for hello(int)>:
  401179:	55                   	push   rbp
  40117a:	48 89 e5             	mov    rbp,rsp
...
There appears to be cloned versions of the original function upon the C++ attribute being applied! These clone functions must’ve been registered onto the clone table(configured in static runtime) that will point to the transaction clones when called from a synchronized block! It makes sense for the registration to happen before runtime if any functions with such attributes are defined. The functions de/register_tm_clones are there in case we want to enable this language feature.